Blog

How improving Return on Capital Employed & operational efficiency can take your retail business to the next level

In a world of fluctuating demand and soaring competition, retailers are turning to data analytics to elevate overall profitability and improve internal business processes. One such retailer from the Middle East approached Matrix & Vectors to implement a data-driven approach to streamline operations and optimize capital deployment. With several foreign brands under its belt, this retailer sought to identify and monitor individual store performance to enable better resource and capital allocation. Here’s how Matrix & Vectors leveraged the power of data analytics to give the retailer’s business a timely boost.

Capitalizing on strategic capital employment

Successful management of capital is key to a healthy, profitable business. That is why retailers are actively adopting data analytics to identify the right investment opportunities at every stage. To help with this, we began by developing a performance matrix that analyzed brands with 10+ stores, based on the following parameters:

  • Stars: Stores with highest profitability in a short span of time
  • Cash Cows: Stores performing well over a longer duration of time
  • Losers: Stores performing poorly over time
  • New Stores: Stores that are too new to judge

With this matrix, we were able to recommend an adaptive capital allocation strategy – a flexible alternative to the retailer’s current investment model. We concluded that the best way forward was to close all non-performing stores (Losers) and reallocate the residual capital to Star Performers, Cash Cows, and other profitable stores.

Graph: Performance matrix for brand X

Performance matrix for brand X

Graph: Performance matrix for brand Y

Performance matrix for brand Y

Powering operational efficiency through better inventory management

While 67% of retailers understand the importance of operational efficiency, only a mere 27% know how to achieve it. However, with a data-driven approach to driving operations, retailers can now efficiently make crucial decisions to maximize profits year after year.

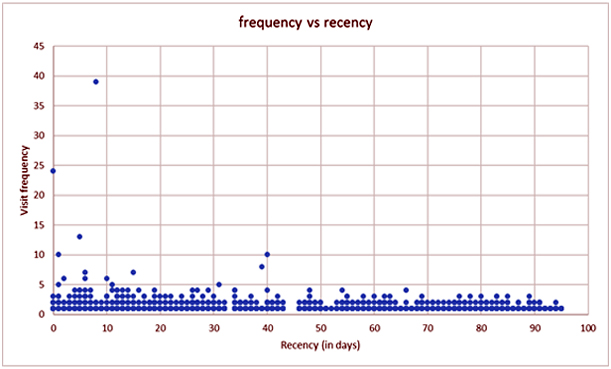
By studying the retailer’s sales per sq. ft. vs weeks of inventory for the previous year, we classified stores into two categories – fast-moving stores and slow-moving stores. A simple scatter plot revealed that the former were understocked and the latter were overstocked. This led to a double whammy of a loss in business opportunity in the fast-moving stores and accumulation of inventory in the slow-moving stores. We then recommended that the retailer readjust stock allocation to ensure higher profitability and consumption of stock.

Graph: Supply vs Sales

Graph: Supply vs Sales

Graph: Inventory vs Sales

Inventory vs Sales

Accelerating business results through a data-driven approach

We also performed Sales Forecasting to determine the critical factors driving sales and predict buying volumes. A similar exercise was then carried out across all of the retailer’s other brands.

By using a data-driven approach to decision making, the retailer recognized the need for better capital allocation and inventory management. This then enabled them to shut down unprofitable stores and bolster the capabilities of the profitable ones – paving the way for sustainable business performance.

Transforming the hospitality industry – the Analytics way

With the Food & Beverage industry at an all-time high, restaurants today are focusing on catering to an ever-growing and discerning audience. From increasing customer retention to menu improvement, Business Analytics is helping restaurants take their services to the next level.

A renowned restaurant chain approached Matrix & Vectors to improve same-store sales and increase revenue by optimizing their menu. Let’s take a look at how this was done.

Boosting Same-Store footfall

The factors that influence customer selection of a particular restaurant are highly unpredictable and numerous – making it difficult to identify motivations for revisit. Given the highly unpredictable nature of the industry, we used a BG/NBD model for analysis.

Customer visit data in the form of reservation and walk-in files was available to build the model. The data included:

  • Basic customer identification details
  • Day of visit
  • Details of purchases
  • Reservation details
  • For walk-ins, the data notably did not include motivations for the customer choosing the particular restaurant

As the first step, basic analysis was performed to identify the distribution of recency and frequency of footfall. The high number of one-time visitors in the raw data set along with the limited time frame covered, were constraints we had to live with while developing the model.

Boosting Same-Store footfall

As a result this model behavior needed tuning and validation. The initial version of the model was built on data of the first half of the time period covered. The resultant predictions were then compared to the actual data of the balance 48 days. Iterative tuning of the model was subsequently conducted to increase accuracy.

The results evident from this analysis highlighted that:

  • The reasons for lack of repeat visits was not identifiable from the available data
  • Predictions made by the model were directionally accurate – with the customer profile most likely to revisit clearly identified
  • The model was able to capture the relationship between recency and frequency of customer visits with accuracy and precision
  • Potential repeat customers could be identified and targeted using vehicles such as social media

Optimizing restaurant menu cards

There’s more to designing an effective menu for a profitable enterprise than just putting together a random selection of dishes. Apart from overriding considerations like the theme of a restaurant or genre of food, menu engineering must be responsive to the popularity and profitability of individual dishes.

For this client, data procured from kitchen and sales records was available for analysis. The data included:

  • Cost of raw materials
  • Quantities of raw material used to prepare specific dishes
  • Itemised quantum of dishes sold

Optimizing restaurant menu cards

The data indicated that munchies were by far the most popular in terms of frequency of ordering. In fact the breakup of the 50 top selling dishes showed a strong bias towards light munchies that could be paired with alcohol rather than main course servings. This was in line with the brand’s image as a lounge.

The analysis was extended to identify the profitability of individual items to help the enterprise retain items with maximum returns while doing away with those providing minimal value.

  • Several low volume and low profitability items were identified indicating that these could be considered for deletion from the menu
  • One particular item, the Bacon add-on, although not low volume, was identified as being sold below cost price. This would require price correction of this item or a corresponding increment to the dishes to which it was offered as an add-on
  • Since munchies were by far the biggest selling category, the restaurant could consider recommendation of specific snack / alcohol pairings based on compatibility
  • It was possible to identify popular dishes for recommendation to new customers
  • More details would however be required to enable targeted recommendation of new dishes / combos to repeat customers based on their past order history

Although the data provided by the restaurant was limited, Matrix & Vectors was able to harness it to help the chain make informed, data-driven decisions. With a more in-depth analysis, restaurants can further boost customer retention by identifying and targeting the right customer base.

e-commerce-portal
How an e-commerce portal integrated the recommendation feature to increase conversions

With 6 out of every 10 online customers influenced by personalized recommendations, e-retailers are now on the lookout for a ‘Recommended for you’ or ‘Forgot to buy’ feature that enhances the e-shopping experience.

One such company is an APAC-based e-commerce retailer that hosts over 18,000 products and more than 1,000 brands on their website. With the primary objectives of reducing the frequency of ‘forgotten’ purchases and improving conversions, the retailer was looking to integrate a recommendation engine into their portal.

Matrix & Vectors had just the right solution – a predictive data analytics tool that helps ensure customers make the most of each purchase!

ecommerce analytics

Bringing Predictive Analytics Tools to the Forefront

 In order to design an effective and accurate recommendation engine, we considered the following predictive analytics techniques:

  • Customer segmentation: Recommendations based on common customer purchases within the desired segment
  • Market-basket analysis: Recommendations based on frequency of items purchased together 
  • Collaborative filtering: Recommendations based on purchases made by similar customers
  • PageRank algorithm: Recommendations based on product relevance


The Right Fit

While techniques such as customer segmentation and market-basket analysis provided in-depth insights, neither was able to generate personalized recommendations. The collaborative filtering technique also proved insufficient as there was a disproportionate variation between the number of customers and overall purchase history.

However, PageRank Analysis – an item-based recommendation tool – consistently delivered useful recommendations with an accuracy of 71% (for every 100 recommendations made by the algorithm).


Driving Better Results the PageRank Way

When the PageRank algorithm was introduced in 1996, the search market underwent a significant shift in the way websites were segmented. This tool helped rank websites or products on the basis of relevance to improve the quality of recommendations. For an e-commerce website, this means that the most relevant products rank right at the top, ensuring customers get the best product recommendations.

With the PageRank analysis, Matrix & Vectors was able to provide the e-retailer with data-driven solutions, paving the way for enhanced customer experience and optimal business outcomes.

consumer packaged good analytics
How a multi-speciality hospital chain unlocked the secret to Capital Allocation

The healthcare industry is a treasure trove of data that remains untapped. Hospitals around the globe can leverage this data to optimize resource allocation and drive better business results. To do this, many hospitals seek specialized tools and techniques that turn raw data into valuable insights.

One such multi-speciality hospital in Bangalore wanted to use data analytics to determine key investment and management decisions. This is where Matrix & Vectors stepped in. By using Big Data analytics and a host of other forecasting tools, we were able to help the hospital successfully achieve their objectives.

The job at hand
The primary objectives of the hospital were as follows:

  • To devise an investment plan based on the growth forecast of diseases
  • To predict the probable number of Operation Theater (OT), Inpatient (IP), and Emergency Room (ER) cases With this in mind, we analyzed historical data (3 years) on patient demographics and surgery, IP, ER, and OT cases.

retail in store analytics

Data analytics to the rescue
We used a variety of forecasting techniques such as Simple/Exponential Moving Average, Holt’s Linear Trend, The Holt-Winters Forecasting Method, and Autoregressive Integrated Moving Average Model (ARIMA) to determine the way forward.

With these forecasting methods, we assessed 52 IP medical specializations in total, of which 15 of them constituted 75% of all patients. We discovered that the top 5 specializations of the hospital chain were:

  • Medical Oncology
  • Cardiology
  • Gynecology
  • Urology
  • Orthopedics

The study also indicated that the Surgical Oncology and Medical Oncology departments were growing at a rapid pace, justifying the need for greater investment.

Forecast errors achieved:

METHODOLOGY CR ENT GT GS GN IM MO NP OR PD PS PM SG SO UR
SMA 12.0 6.80
ES
HOLT – WINTER 5.91 10.7 7.93 6.12 8.05 8.51 36.4 14.2 8.82
ARIMA 6.58 9.62 18.6

Legends:
CR – Cardio; GT – Gastroen; GN – Gynae; GS – Gen.Surgery; IM – Internal Medicine; MO – Medical Onco.; NP – Nephro; OR – Ortho; PD – Paediatrics; PS – Plastic Surgery; PM – Pulmo; SG – Surgical Gastroen; SO – Surgical Onco; UR – Urology

Data is the answer
From predicting epidemics to curing diseases, and streamlining supply chain to accelerating sales – Big Data & Analytics is changing the face of how organizations work, the world over.